
- Notes by Tag
- All Notes by Date
- Essays and General Writings
- Slipbox Research Notes
- Coarse Grained Models of CT
- Niche Construction and CT Modeling
- CT of Structured Information
- Notes by Experiment
- Notes by Simulation Model
- Cultural transmission theory
- Darwinian evolutionary theory
- Dissertation Research
- Reading notes
- Open Research Problems
- Bio
- Software
- Tools I Use
- Publications
- About Open Science
- About this Notebook
CTMixtures Equifinality - Calibration Experiment and Conclusions
| Created: 06 Oct 2014 | Modified: 23 Jul 2020 | BibTeX Entry | RIS Citation |
Excess Variation?
About a week ago, I ran equifinality-2-small, which simulated 1000 samples from each of the 4 models. I’m not sure what I think about the data. A random forest classifier is clearly able to distinguish neutral from all biased models, given synchronic population statistics.
But there’s so many variants in the population, even given the difference in per-locus versus whole trait set copying rules I discussed in the previous note.
The distribution of Slatkin test values, when I use the raw per-locus values, those for the neutral models look well distributed (this is the distribution of outcomes from the “Chinese restaurant process”, which is equivalent to the Ewens Sampling Formula).
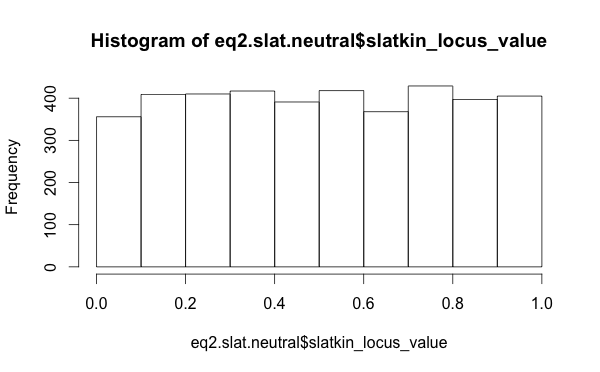
So this suggests that looking at summary statistics for the Slatkin values was misleading. Perhaps the neutral model is functioning just fine.
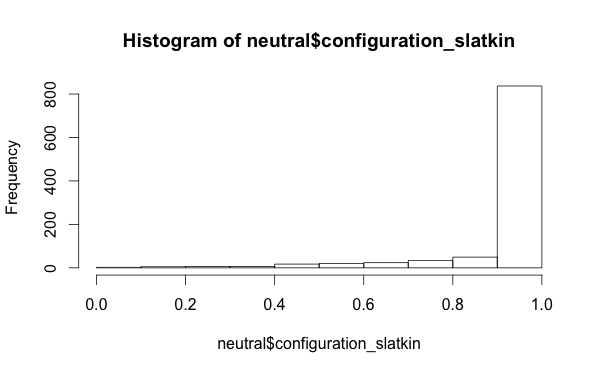
And, which might be interesting from a research perspective, that intersecting traits and looking at the Slatkin tests of the configuration frequencies doesn’t give you a uniform distribution of Slatkin test values even with a neutral model-
I also looked at the per-locus richness values, not the mean/min/max summaries, but just the raw richness values. My package library mmadsenr has a function for applying Equation 4 from Ewens (1972). We can compare the expected number of traits given the Wright-Fisher infinite alleles model (which will differ from the Moran model by a small factor), to the simulated samples, with the following R code:
# pull in the per-locus richness data, this can be compared to Ewens 1972, equation 4
eq2s.rich <- read.csv(file="eq2s-pop-richness-locus-data.csv")
eq2s.rich.neutral <- filter(eq2.rich, model_class_label == 'allneutral')

popsize <- 100
innov_rates_for_abline <- c(0.1, 0.5, 1.0, 2.0, 3.0, 4.0, 5.0)
# expected K for innovation rates
expected_k <- numeric(length(innov_rates_for_abline))
for (i in 1:length(innov_rates_for_abline)) { expected_k[i] <- expected_k_pop(popsize, innov_rates_for_abline[i])}
expected_k_abline <- data.frame(innov_rates_for_abline, expected_k)

# plot
plt <- ggplot(data=eq2s.rich.neutral, aes(x=innovation_rate, y=richness_locus_value)) + geom_point(alpha=1/2,size=1) + geom_abline(data=expected_k_abline, color="red")
plt + xlab("Scaled Innovation Rate") + ylab("Number of Traits at a Dimension/Locus")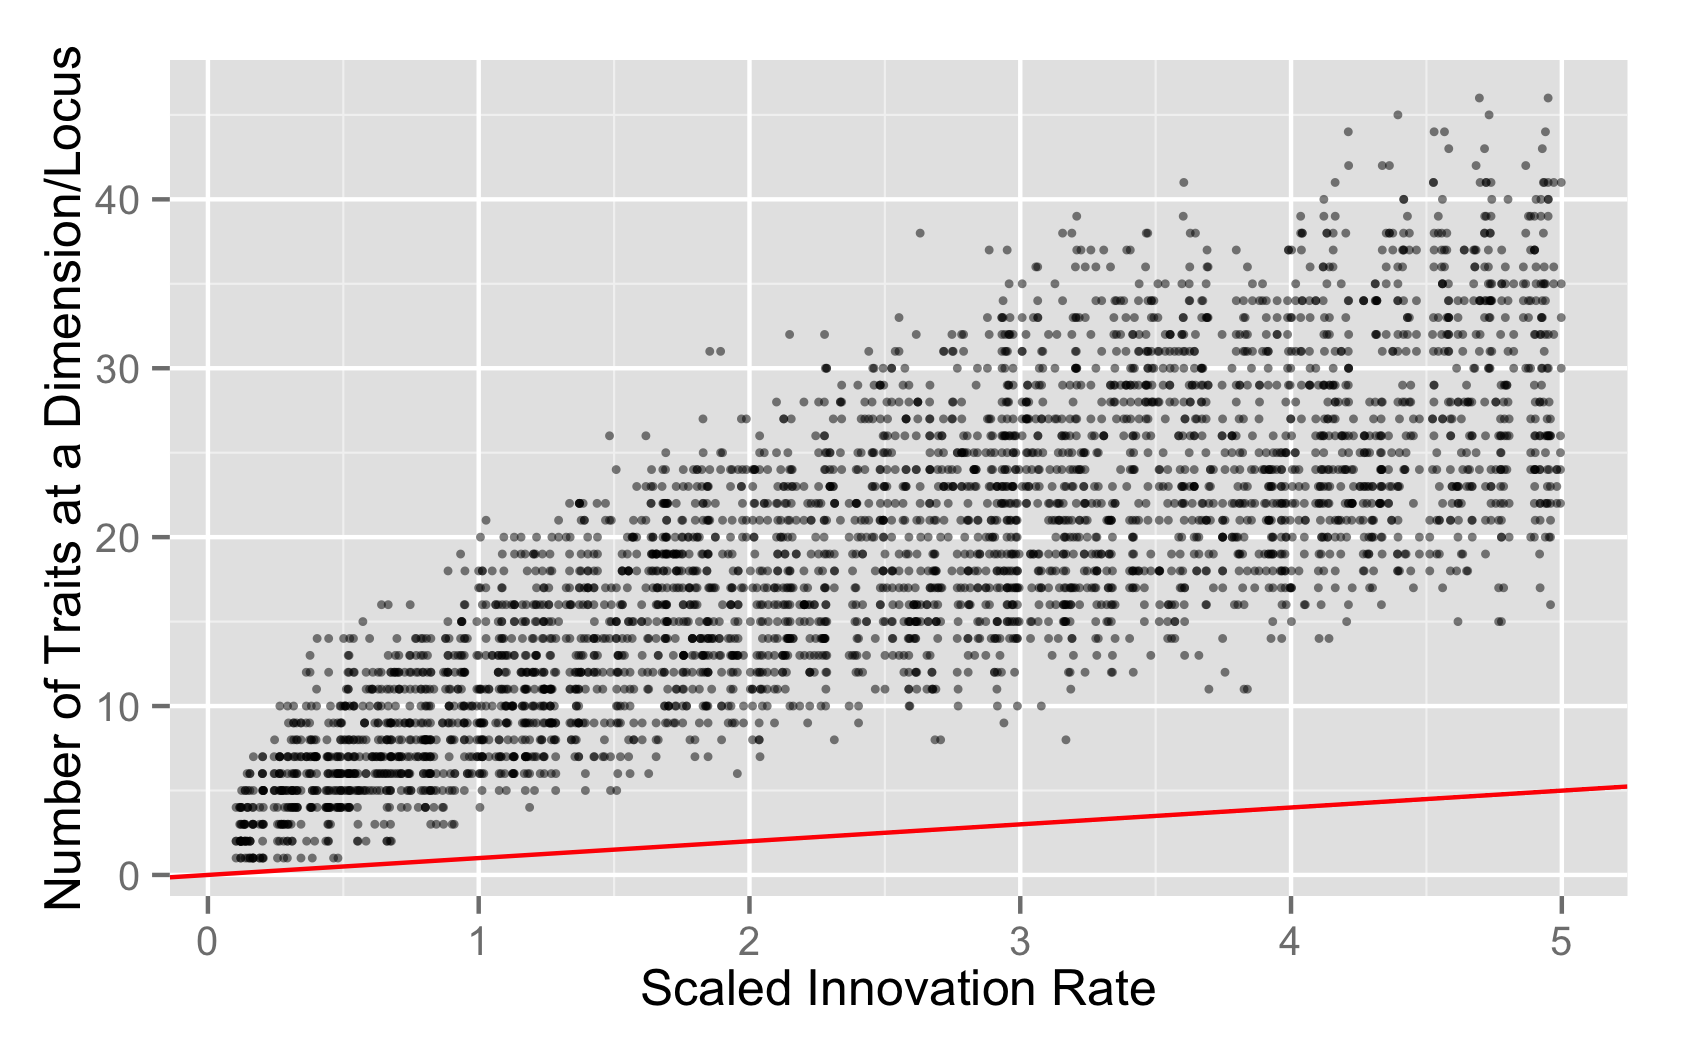
Possible Causes
- The neutral process is functioning just fine, and the distribution of richness is what you’d expect from a single locus copying process.
- The neutral process is functioning just fine, but the process hasn’t washed out the initial level of variation and reached equilibrium by 1MM steps.
- There’s something wrong with the neutral model.
The last seems unlikely given the spot-on distribution of Slatkin values on a per locus basis, but I’d like to have better calibration on how much variation to expect in this per-locus copying model, instead of the whole genome copying model.
I might need to convince myself that the rest of the machinery is working by doing some samples from the whole-traitset copying version of neutrality, because the abline ought to lay over the distribution in that case.
Both Copying Models and Multiple Simulation Lengths
Today, I looked at “all locus” versus “random locus” models, and also varied the maximum length of the simulation, doing “all locus” models for 4 and 8 million steps. The results in Figure 4 are combined with the original random locus values for 1MM steps in equifinality-2-small:
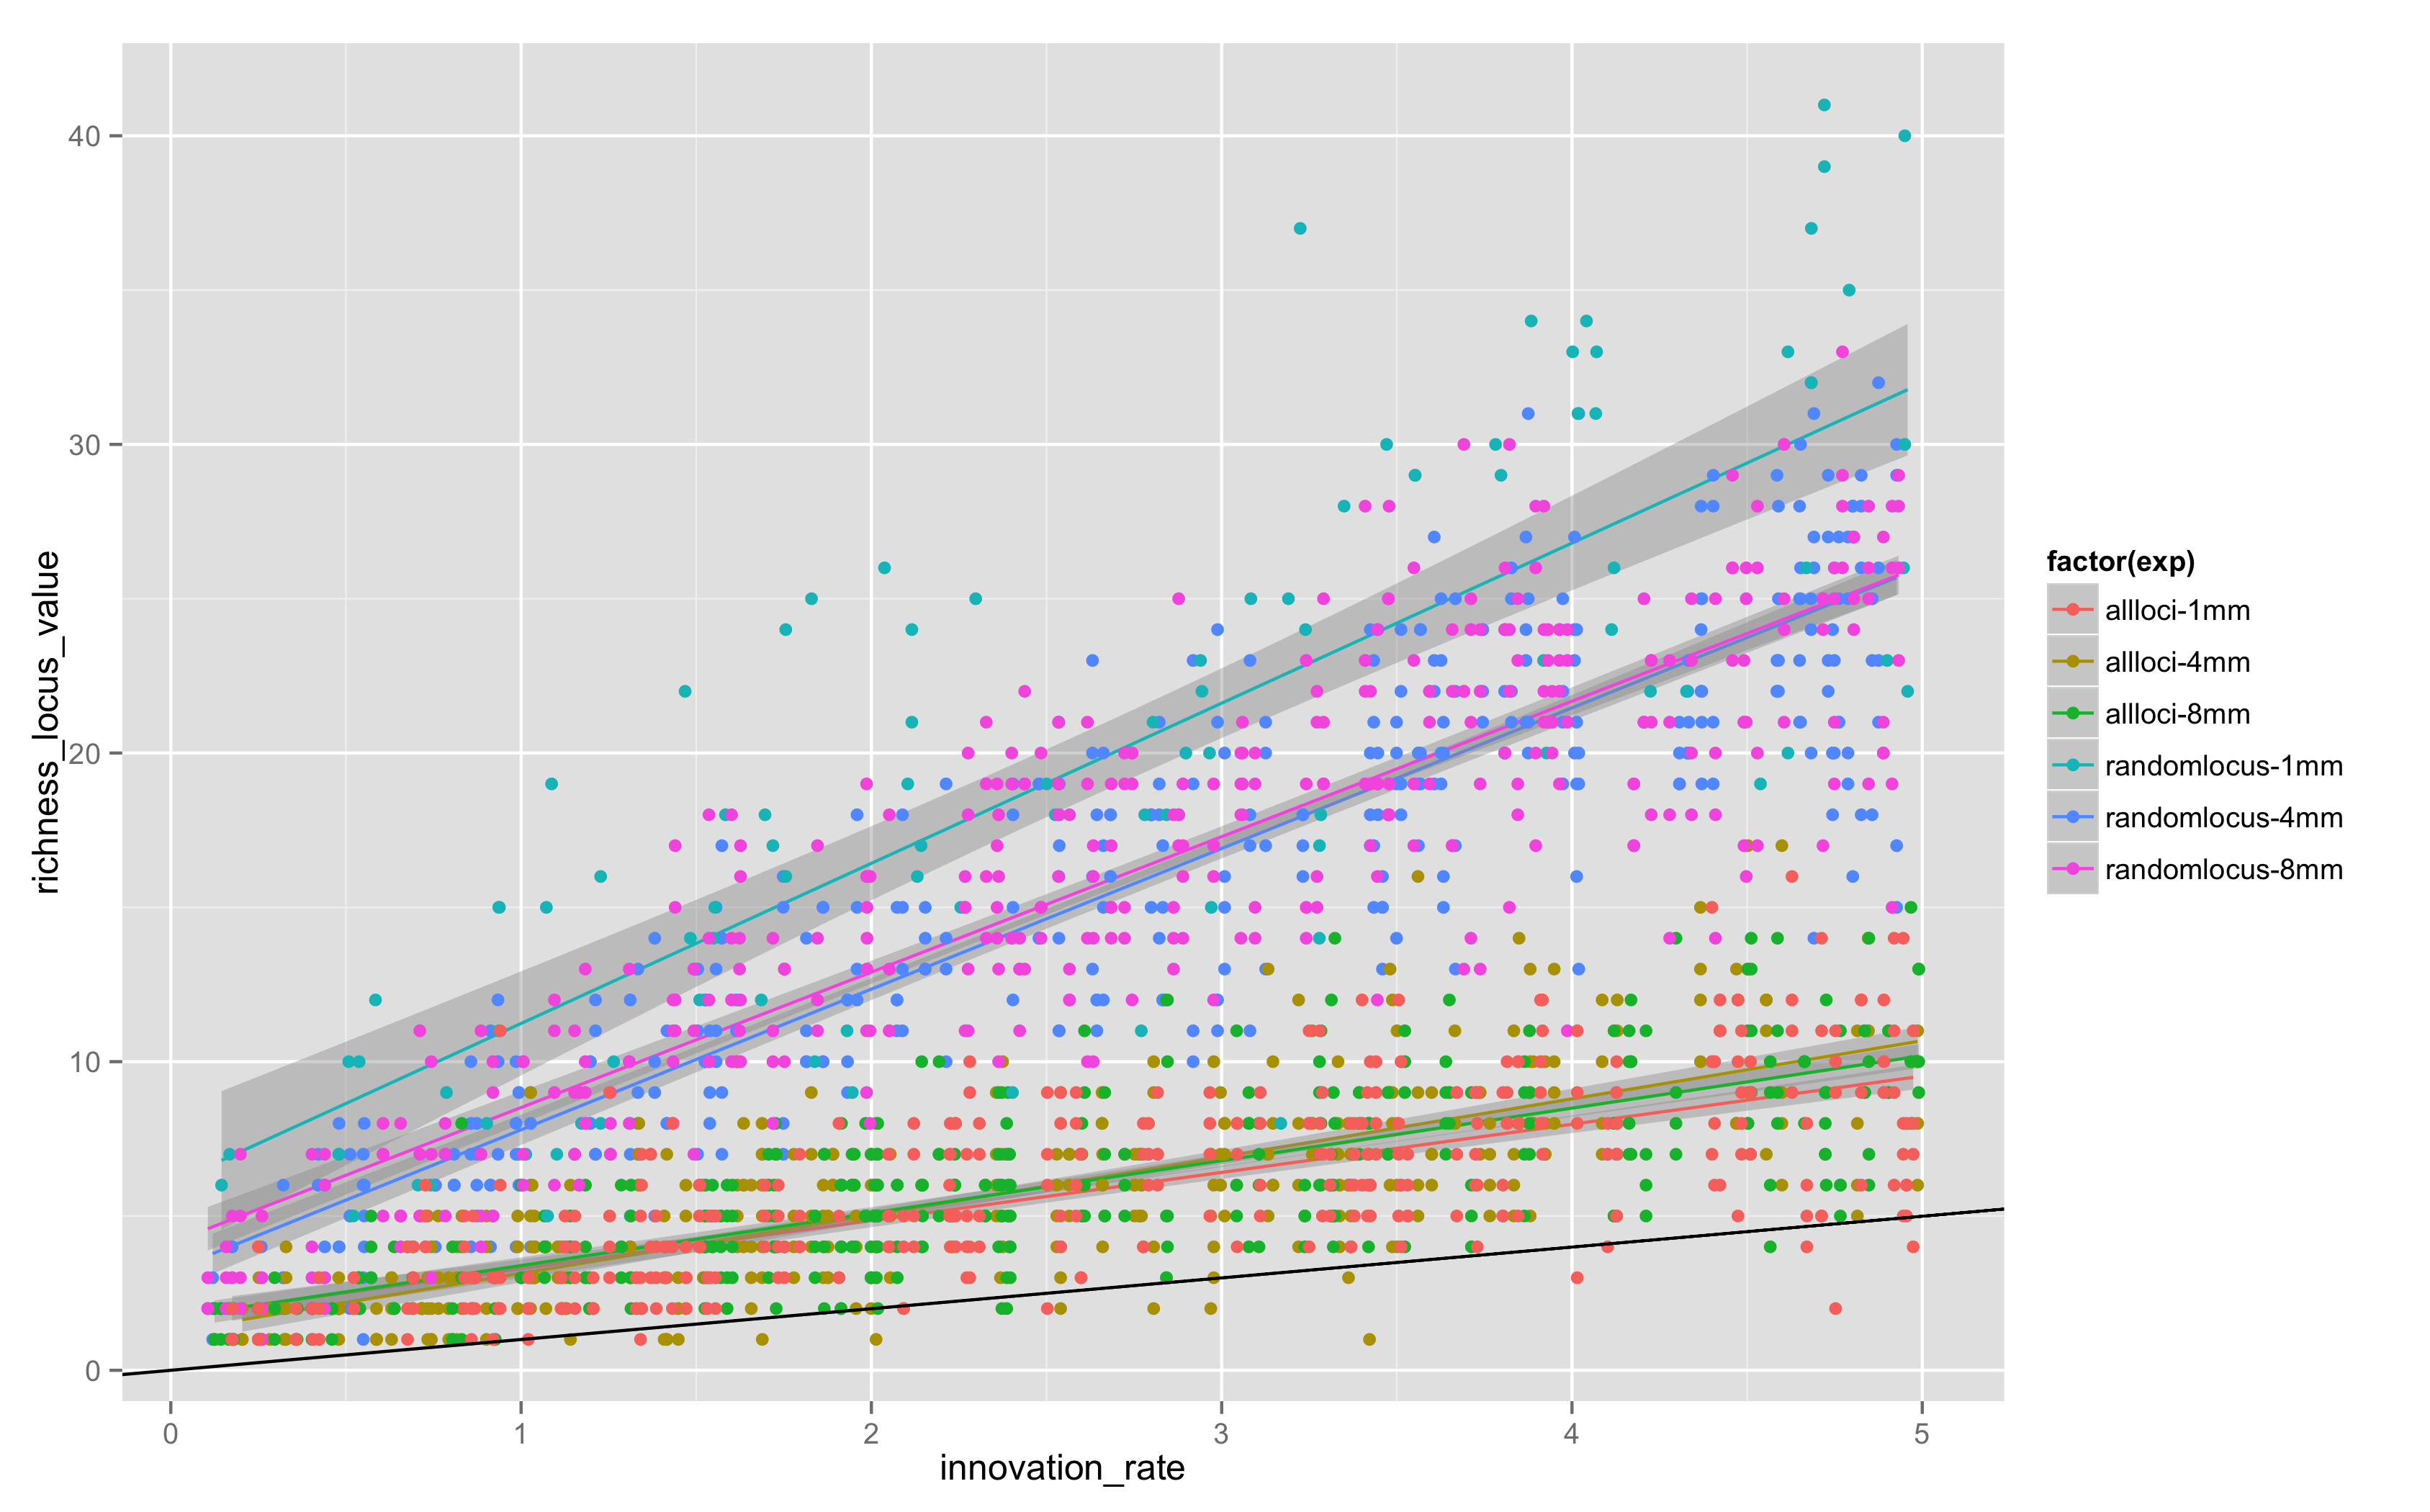
Two things are apparent.
There is definitely more variation in random locus models, probably because it takes longer for any given allele to drift out given that not all loci are replaced by a copying event.
1MM steps is not enough – the 4 and 8 million step models have clearly reached stationarity, but 1MM and 4MM aren’t close, so somewhere between 1MM and 4MM steps is the stationarity point. There is little change in the location or slope of the trends between 4MM and 8MM.
Next Steps
The next step is to repeat equifinality-2 across all four models, using 4MM steps per simulation run, and then repeat the random forest analysis.
I plan to run equifinality-3 as a full model run, with 25,000 samples per model, for a total of 100,000 data points. I’m going to run it on a StarCluster with 4 instances of c3.4xlarge type, for a total of 64 vCPUs. This should take between 3 and 4 days, with an initial cost estimate of about $300.
References Cited
Ewens, W.J. 1972. “The Sampling Theory of Selectively Neutral Alleles.” Theoretical Population Biology 3 (1). Elsevier: 87–112.