
- Notes by Tag
- All Notes by Date
- Essays and General Writings
- Slipbox Research Notes
- Coarse Grained Models of CT
- Niche Construction and CT Modeling
- CT of Structured Information
- Notes by Experiment
- Notes by Simulation Model
- Cultural transmission theory
- Darwinian evolutionary theory
- Dissertation Research
- Reading notes
- Open Research Problems
- Bio
- Software
- Tools I Use
- Publications
- About Open Science
- About this Notebook
Description of the SeriationCT Model
| Created: 17 Jun 2014 | Modified: 23 Jul 2020 | BibTeX Entry | RIS Citation |
Overview
The seriationct model is intended to simulate a regional-scale model of coarse grained cultural transmission, occurring in a set of local populations which interact within and between demes, over time scales which are much longer than individual transmission events, and longer than the turnover rate for demes themselves. The purpose of the model is to generate time averaged samples of cultural traits, which can be studied using standard archaeological methods, such as seriation.
The goal of the study is to rigorously connect the properties of seriation solutions in a region, with a coarse-grained model of interaction and cultural transmssion in a regional metapopulation. Since we’re treating CT at a coarse-grained level, appropriate for samples of cultural traits which come from assemblages with significant durations and from heterogeneous populations, the variable aspect of the model is the pattern and density of interaction between local subpopulations. I should note that the analysis is restricted to settlement patterns which are sedentary and nucleated; the models underlying coarse-grained CT analysis of mobile populations will be different.
Formally, then, my goals are:
- To understand the correspondence between seriation solutions, and variation in regional interaction models
- Infer regional interaction models (or equivalence classes of models, given observable overlap) from seriation solutions and class frequency statistics.
Regional Interaction Models
Interaction within a deme is assumed to be well-mixed, and in general given the effects of coarse graining on mixtures of social learning rules, transmission is modeled as unbiased copying.
Interaction of individuals between demes occurs according to a diachronic model which specifies:
- Which demes are connected, and which lack connections
- The normalized strength of the connection, or weight
This model can be represented by a time-indexed set of weighted adjacency matrices, and is a “temporal network” in the sense studied by (Holme and Saramäki 2012). During interactions, individuals are given neighbors in connected demes in proportion to the weights, to allow a normal “choose a random neighbor” algorithm to represent both intra- and inter-deme copying. This is an implementation detail, and is not crucial to the semantics of the model.
In addition to change in the edges of the network, the temporal network can add and delete vertices, representing the origin and abandonment of new communities. When a new deme is formed, it is seeded by a sample of individuals from surrounding demes, and connected according to the connectivity model.
To make specification of the model and research problem easier, here is a depiction of three points in time in a temporal network of communities, with time increasing from left to right.
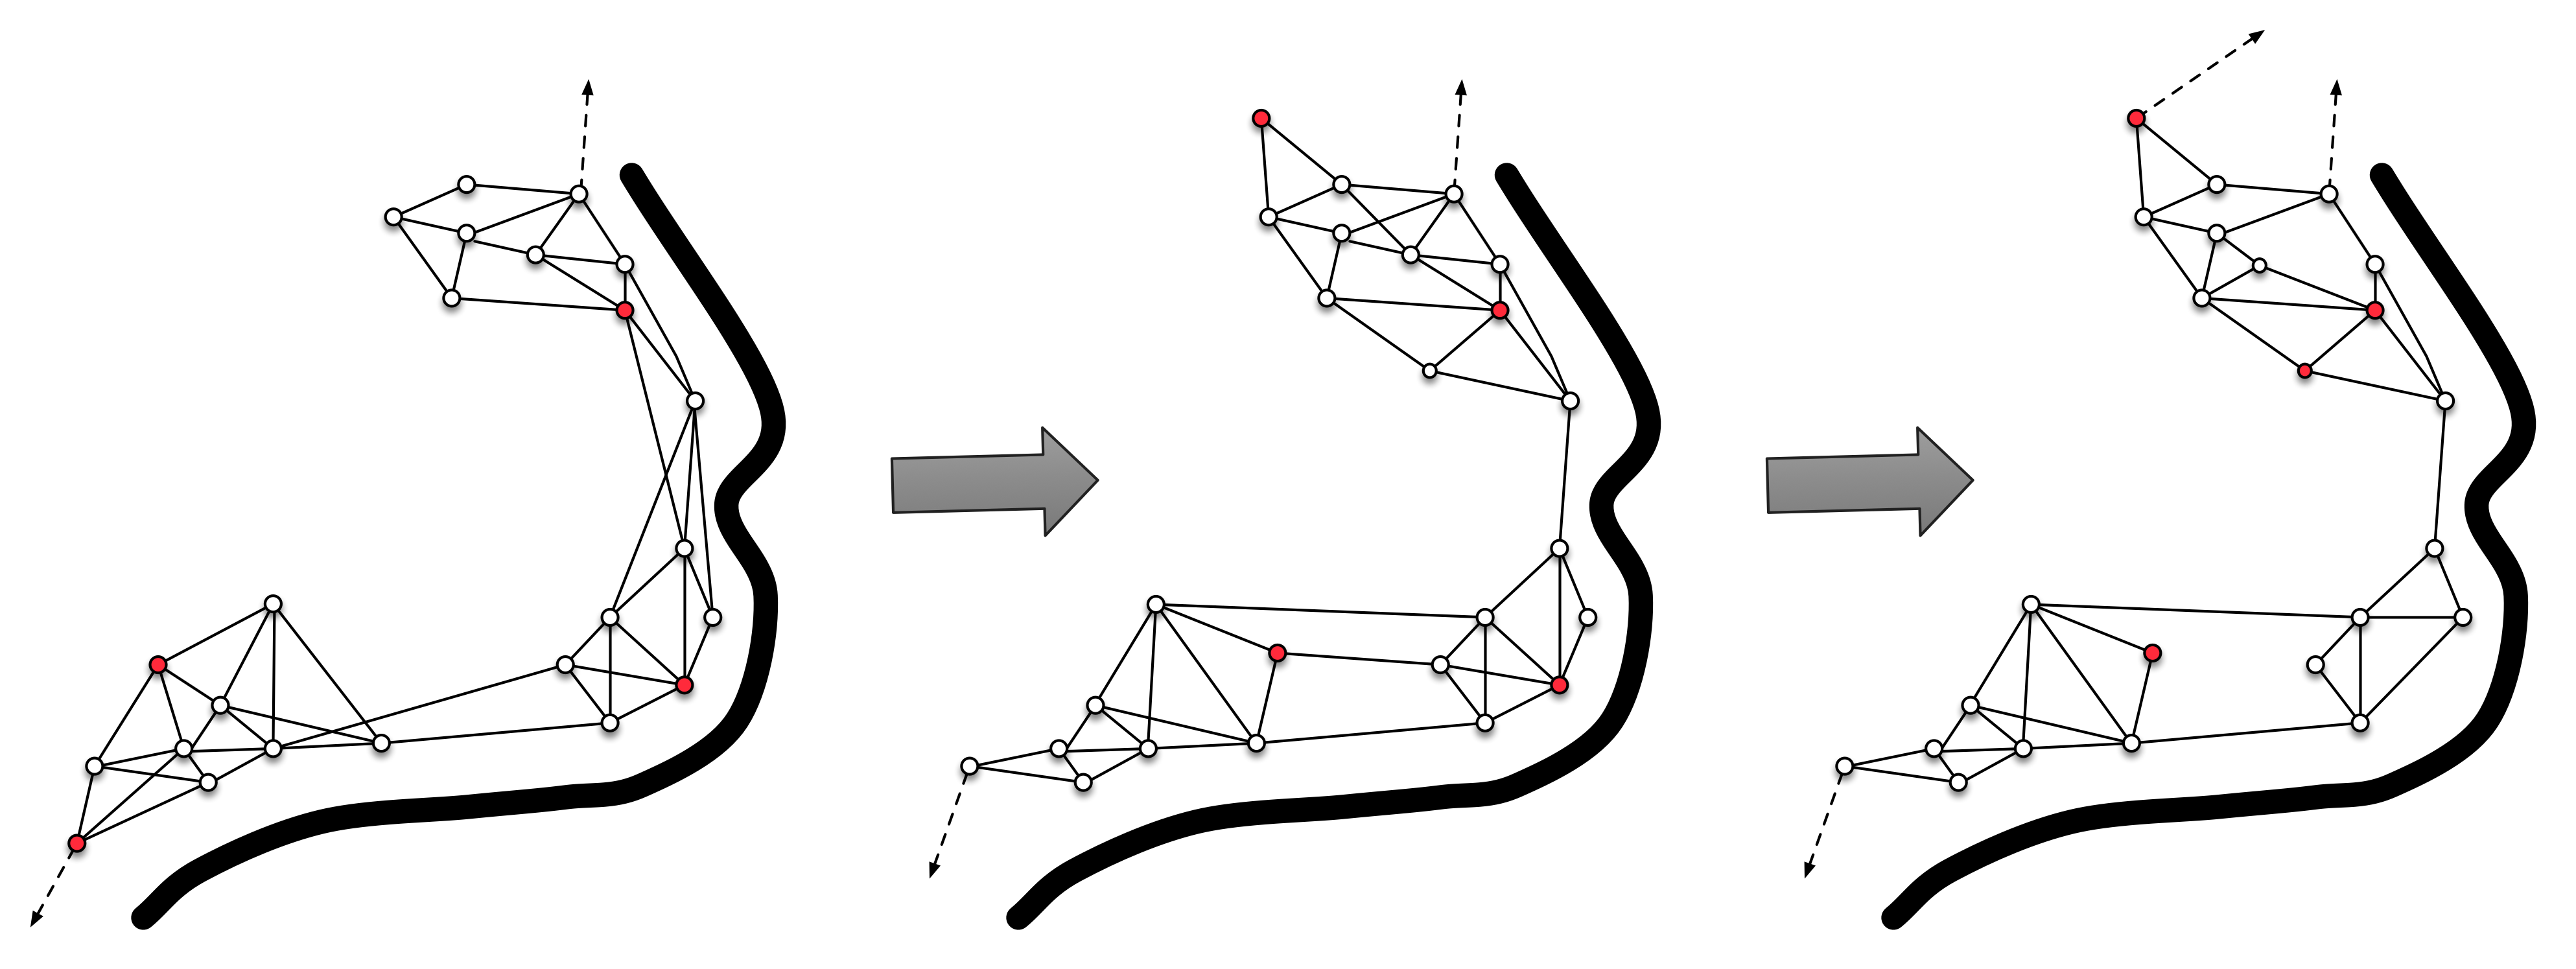
In Figure 1, vertices represent communities which leave artifactual remains, sampled later as assemblages representing depositional events over some period of time. Vertices appear and are lost over time, representing the establishment and loss/abandonment of locations by local populations. Edges represent significant interaction between local communities. In this diagram, I do not place weights on the edges for visual clarity, so simply think of edges as representing greater than average interaction, compared to pairs of vertices between whom there is no regular interaction (e.g., trade, intermarriage, etc).
In this simple example, I show clusters of communities spread along a river (like many examples in Eastern North America). Several communities go away, several new ones come into existence, but the main pattern is that connections become sparser between major “groups” of communities. This occurs first between the northernmost communities and the middle and southern, which replaces the oldest pattern where dense interaraction occurred between northern and middle communities. Later, the connections between middle and southern communities thin out, as well.
The red vertices represent a set of sampled assemblages which give us time-averaged trait information from the duration of occupation of each locality. Note that we have some samples whose duration is mostly early, others mostly late, and one sample whose duration spans the entire sequence.
See Note: Temporal Networks in SeriationCT for more details on exactly how the temporal network model represents this type of evolving regional interaction.
Sampling
Observables are calculated by taking coarse grained samples of trait frequencies which approximate several key features of real archaeological phenomena:
- Samples are accumulated over a varying range of durations, to simulate time averaged deposits.
- Samples are identified to a paradigmatic classification (or classifications)
- Samples are labeled as to deme of origin
The resulting samples are then available for seriation and other statistical analyses, to measure the ability to infer the history of demes, and elements of the diachronic connectivity model.
Analysis
TBD.
References Cited
Holme, Petter, and Jari Saramäki. 2012. “Temporal Networks.” Physics Reports 519 (3). Elsevier: 97–125.