
- Notes by Tag
- All Notes by Date
- Essays and General Writings
- Slipbox Research Notes
- Coarse Grained Models of CT
- Niche Construction and CT Modeling
- CT of Structured Information
- Notes by Experiment
- Notes by Simulation Model
- Cultural transmission theory
- Darwinian evolutionary theory
- Dissertation Research
- Reading notes
- Open Research Problems
- Bio
- Software
- Tools I Use
- Publications
- About Open Science
- About this Notebook
SeriationCT Next Steps
| Created: 27 Apr 2015 | Modified: 23 Jul 2020 | BibTeX Entry | RIS Citation |
Network Models
Prior to the SAA conference in SFO this April, I performed 28 different network model experiments (seriationct-1 through seriationct-28). Each had a different starting temporal network model, generated by one of two network generator programs. The early experiments (through 12 or 15 or so) used an initial cut at network modeling, which was too constrained in various ways. I was not able to recovery what I thought was the structure of the network.
Subsequently, I simplified the network generator into two executables. It now produces M clusters of N communities. Each community is fully connected to other communities in the same cluster, and in addition, there is a small fraction of communities that are connected between clusters. In addition, each community in the model lasts for a single network slice, before being replaced by another slice of communities, each of which has a randomly sampled parent in the previous time interval.
In the first program, there is a single “lineage” with the cluster structure just described. The linkage between clusters represents the only mesoscopic structure. I did not get clear recovery of this structure, at least with the number of loci/classes, innovation rate, and migration rates tested.
In the second program, I produced two models: lineage splitting, and lineage coalescence. In the former, at early times, M clusters of weakly interconnected communities evolve to a splitting time, at which point the single lineage of M clusters splits into L lineages of \(M/L\) clusters of communities each, and continues evolving with weak interconnections within the lineage but NO edges between lineages, until the stop time. The lineage coalescence is a mirror image, starting with L lineages and coalescing them into a single lineage.
Lineage Splitting/Merging Experiments
With the lineage split/merge model, the idea is to use seriation to recover the major lineage structure of the model.
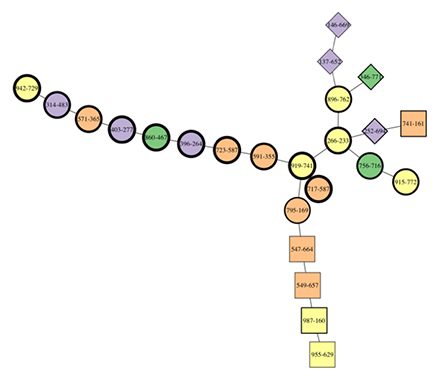
The annotation convention used is:
- Shape represents the lineage, with the “parent” or “child” lineage coded as circles (i.e., presplit or post-coalescence), and squares/diamonds/other polygons used to denote separate lineages.
- Color denotes cluster membership
- Shape rim thickness indicates time, with thin equalling early samples, and thick indicating late.
In Fig. 1, the lineage structure is evident. Two lineages on the right begin early, and come together with some circles to form a single lineage, which continues to the left with thicker shapes. There is some confusion around the branch point, with some later assemblages mixed into the terminal end of the earlier branches. But in general this is darned good.
The difficulty is that only some samples from a given network model/CT simulation yield clear structure. Some don’t at all, even though they’re samples from the same underlying data set. There are several possibilities for why this would happen:
- It’s difficult to recover this kind of structure, and the nature of your sample of assemblages is important. If you’re missing some key assemblages from a key time period, you may not be able to thread together the changes.
- Some of my seriation settings for continuity thresholds, for example, might be too strict given the gaps between sampled assemblages. With more assemblages, the lineage structure might be obvious with a given threshold level, but with smaller samples the gaps will be wider and thus it’s harder to put together certain combinations that actually give us the lineage structure we seek.
Of course, both can be occurring. Now it’s time to figure out what’s going on.
Next Steps
The next steps are to focus on tweaking the factors just listed and seeing what encourages robust lineage structure recovery. We need:
- A method of telling whether an annotated minmax graph displays the lineage structure from a given ITN (as given by a zip of the GML slices). Given a constrained set of lineage structures, this should not be difficult to assess if I can get a robust way of assessing the number of major branches, and compare these with time direction.
- Construct a master XY file for the simulated experiments (we need to retain a real XY file since empirical examples will have nonarbitrary coordinates), so that we can run some of the post-processing scripts batching together different network models into a pipeline – currently there is one point where doing this is hazardous, noted in the debug output.
- Record the network model zipfile to be used for a given simulation run’s output, again to allow us to batch output coming from multiple network models into a pipeline.
- Consider using a work queue model to drive the pipeline on a cluster, so that batches can truly run without intervention.
- Consider databasing all the intermediate processing status?
- Definitely database the results of comparing the annotated minmax graph to the generating network model, along with all the parameters needed.
This will allow a large batch with replicates, to see where we get good, reliable recovery, and where we don’t.