
- Notes by Tag
- All Notes by Date
- Essays and General Writings
- Slipbox Research Notes
- Coarse Grained Models of CT
- Niche Construction and CT Modeling
- CT of Structured Information
- Notes by Experiment
- Notes by Simulation Model
- Cultural transmission theory
- Darwinian evolutionary theory
- Dissertation Research
- Reading notes
- Open Research Problems
- Bio
- Software
- Tools I Use
- Publications
- About Open Science
- About this Notebook
CTMixtures Equifinality Analysis - Initial Ideas
| Created: 18 Sep 2014 | Modified: 23 Jul 2020 | BibTeX Entry | RIS Citation |
Rough Test 1: Population Data
I’m not finished with the data export program yet, working out how to flatten multiple loci and other list/nested data structures. This is particularly important since some elements are measured only once (e.g., configurations or classes) while others are measured on a per-locus basis. At the same time, there’s an element of feature selection and engineering occurring, which is happening via a trial random forest classification.
The population census data are fairly easy and finite, so I’ve already got them exported with an initial cut at the program, with the following predictors for the four model class labels:
- Slatkin exact test for the configuration or class counts in the population census
- Number of configurations in the population at sample time
- Per-locus Shannon entropy of trait frequencies
- Per-locus IQV diversity of trait frequencies
- Per-locus richness of traits
- Kandler-Shennan traits surviving after 50 generations
A very quick random forest fit on 80% of the data as training data (with typical classification values) shows that there’s a lot of error correctly classifying data points, and thus good hints of equifinality.
Call:
 randomForest(formula = factor(model_class_label) ~ ., data = train,      ntree = 1000, nodesize = 1, mtry = 3)
               Type of random forest: classification
                     Number of trees: 1000
No. of variables tried at each split: 3

        OOB estimate of  error rate: 48.24%
Confusion matrix:
             allneutral mixantidom mixconfdom mixconfequal class.error
allneutral        27560       1515       1986         1014   0.1407638
mixantidom         1659      14881       6724         8700   0.5344450
mixconfdom         2006       7925      13822         8173   0.5670613
mixconfequal       1665      10860       9526         9984   0.6883409
Prediction error on the remaining 20% of the data is 0.516. But there’s an interesting pattern here, and some issues with the data export.
First, it doesn’t seem nearly as hard to tell neutral models from biased models, as it is to tell different bias models apart, as you’d expect. Perhaps this should be the expectation given synchronic population census. We’ll see how this plays out in synchronic sampled data, and of course TA and sampled data. But I should also do a binary classification, lumping the bias models together, and simply predicting neutral vs. bias.
But second, some of the values are repeated in each row, since a row represents a locus, not a simulation run. I should do further feature engineering and have only one row per simulation run in the data export, and use variables like min/max/median richness, entropy, etc. This will apply to all multilocus data.
Rough Test 2: More Variables and
I recoded the export script, and stopped exploding each locus into a data row. Instead, for each primary predictor, I calculate min and max (e.g., min richness and max richness) across the number of loci present. For a single locus simulation, obviously these will be the same value and we’d only use one of the two predictors and relabel them, but in equifinality-1 we have 4 loci.
The random forest improves a little bit, but the overall pattern still looks the same.
But, the neutral data are worrying me. In equifinality-1 I used the “all loci” copying rule, and I’m also turning the single scaled innovation rate into a per-locus innovation rate. I think there’s an issue here somewhere. Granted, with the Moran dynamics, I can’t expect that the expected number of alleles will exactly match the Wright Fisher dynamics, but the observed numbers seem high. Also, the distribution of Slatkin rest results seems skewed.
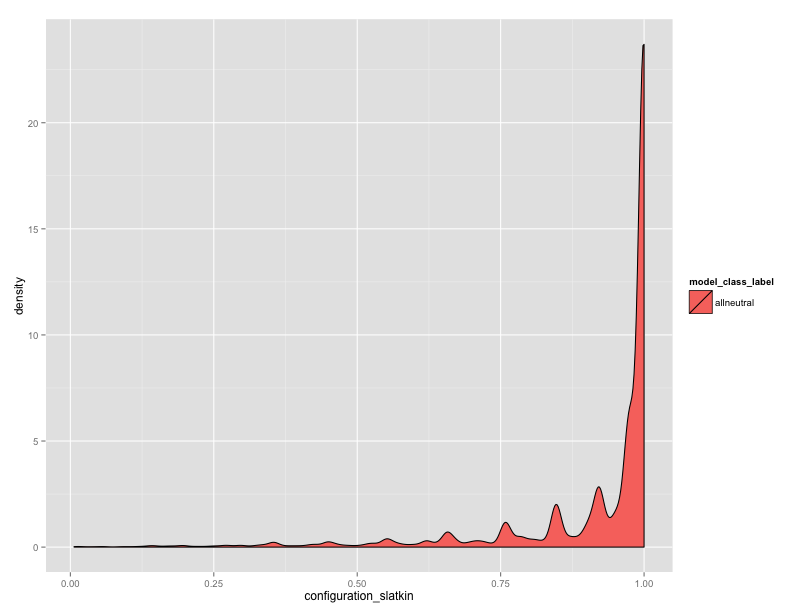
We have many different innovation rates represented here, but still, there should be many more values towards the center.
I’m wondering about several possible sources of issues before I go any further:
- Is the innovation rate algorithm working properly?
- Is the all-locus copying the way to go?
The distribution of theta values looks good, when I did a histogram.
Analysis Code
The short script I used for the explorations here:
library(randomForest)
library(miscTools)

df <- read.csv("~/local-research/diss/experiments/experiment-ctmixtures/equifinality-population-data.csv", header=T)
# we don't want to treat the sim run ID as one of the predictors...
drops <- c('simulation_run_id')
dataset <- df[,!(names(df) %in% drops)]

# shuffle the data frame row-wise so that we can randomly sample test and training data from it
shuffled_df <- dataset[sample(nrow(dataset)),]
indexes = sample(1:nrow(shuffled_df), size=0.2*nrow(shuffled_df))
test = shuffled_df[indexes,]
train = shuffled_df[-indexes,]


fit <- randomForest(factor(model_class_label) ~ ., data=train, ntree=1000, nodesize = 1, mtry=3)
print(fit)
#varImpPlot(fit)

# evaluate on test data
table(test$model_class_label, predict(fit, test[names(shuffled_df)]))

# test error
sum(test$model_class_label==predict(fit, test[names(shuffled_df)])) / nrow(test)